The Estate Sale
A connection through “Who really owns it?”: Follow the ownership and control behind infrastructure, money, and information.
A decade after the referendum, the cleanest Brexit story is neither collapse nor liberation. It is the carrying cost of sovereignty — line by line: trade, migration, the City, Northern Ireland, Solvency UK and the UK-EU reset.
Britain did not just leave a market. It bought itself a second operating system. Every border form, every visa route, every regulatory consultation, every duplicated bank balance sheet sitting in Frankfurt and London at once is part of the same bill. Sovereignty has fixed costs, and Britain underpriced them.
You were sold Brexit as control. Some of that control is real. The UK writes its own immigration rules, designs its own insurance regime, runs its own subsidy system and decides for itself whether to copy Brussels or not. The surprise is what control actually demands once the slogan ends. Lawyers, customs officers, regulators, data systems, Whitehall time, duplicated balance sheets — and political pain every time the government tries to reduce friction by accepting rules from outside the country.
Ten years on, the question is no longer whether Brexit happened. It is what it cost, what it bought, and what Britain still owes on it.
The most useful Brexit number is no longer the loudest one. In 2016, the Treasury warned of an immediate recession. It never came. The Centre for European Reform built a widely cited model that compared Britain to an imaginary "twin" version of itself that stayed in the EU. Its author quietly retired the model in 2023 after the 2022 energy crisis distorted the comparison — the imaginary twin was made up of countries that took an even harder hit from gas prices, which exaggerated the gap. That does not make the Brexit cost vanish. It makes the honest range narrower, slower and more boring than either side spent a decade arguing about.
The serious independent estimate now belongs to the National Institute of Economic and Social Research, the country's oldest economics think-tank. Its model, updated quarterly, puts UK output 2.5 per cent lower in 2023 than it would have been under continued EU membership, with wages 5.8 per cent lower, productivity 1.3 per cent lower and investment 12.4 per cent lower (NIESR, Revisiting the Effect of Brexit, November 2023). The Treasury's independent forecaster, the Office for Budget Responsibility, assumes a long-run 4 per cent productivity drag from a 15 per cent fall in how much Britain trades. That number is the assumption inside the official forecast — not a measured outcome. The distinction matters whenever a politician quotes it.
The strongest dissenting voices have more substance than they are usually given credit for. Briefings for Britain, a pro-Leave research outlet, compiled OECD growth data and pointed out that between mid-2016 and mid-2022 the UK economy grew 6.8 per cent — slower than France at 7.6 per cent, but faster than Germany at 5.5 per cent and Italy at 4.0 per cent. The UK was in the middle of its peer group, not visibly behind it (Gudgin, Jessop and Western, October 2022). The free-market Institute of Economic Affairs added that UK trade did not collapse: goods exports to the EU rose 13.5 per cent in cash terms between 2019 and 2022, while exports to the rest of the world rose 14.3 per cent (McBride, November 2023). Treat these as critiques of overclaim, not as evidence Brexit was free. The basic economic logic still applies: a mid-sized economy made trade with its nearest large market more expensive, and trade with that market grew more slowly than it would have done.
![A bureaucrat on a stepladder crossing out the Vote Leave bus's '£350 million a week' slogan and writing 'Actually, £[__] a week to run it ourselves.'](/content-assets/brexit-bus-corrected-AOYCYWJK.png)
OECD national accounts as compiled by Briefings for Britain, October 2022. Used as a defined-period peer comparison; choice of period matters.
The failed forecast was the recession. The surviving bill is the drag.
The cleanest Brexit wound is goods. The shipping container — the pallet of shellfish, the consignment of car parts, the parcel of clothing — now has to clear a regime that did not exist inside the single market. Customs paperwork, rules-of-origin checks, safety certification and food and animal inspections all add small costs that compound. UK goods exports were around 10 per cent below 2019 levels at the end of 2023, while goods trade across the rest of the G7 was roughly 5 per cent above (Office for Budget Responsibility, How are our Brexit trade forecast assumptions performing?, March 2024).
Fishing illustrates the trade-off in concrete form. The 2020 deal gave Britain a phased 25 per cent uplift in fishing quotas in UK waters by mid-2026, which was sold as a clear sovereignty win. The reset summit in May 2025 then extended European fishing-fleet access for another twelve years (House of Commons Library, July 2025). Coastal Britain got the rhetoric and a slightly different shape of the same constraint. The pattern repeats across goods: the deal kept tariffs at zero, then re-introduced friction in the form of paperwork.
Services were a different story. London-based legal, accounting, consulting and creative firms can deliver work digitally without crossing a physical border, and global demand for these services rose throughout the post-pandemic recovery. UK services exports were roughly 12 per cent above 2019 levels by the end of 2023. The Brexit hit was specific: financial services exports fell 5.9 per cent and transport services fell 2.0 per cent (Office for Budget Responsibility, March 2024). The headline "services boom" obscures a sector-specific bruise where Brexit bit hardest.
The map of who paid is uneven. Sunderland's car factories survived under tariff-free trade but found the investment case more conditional once components had to prove their origin. Boston's farms found their supply of seasonal labour cut off and replaced with administration. Stoke-on-Trent's ceramics industry added new export friction on top of a long-running productivity problem. The Warwick economists Sascha Becker and Thiemo Fetzer have done the most detailed district-level work on this; their finding is not that Brexit punished its voters in some theatrical way, but that places with thinner investment margins and more goods-heavy exposure had less capacity to absorb a new fixed cost.
| Place | Exposure | What changed after Brexit |
|---|---|---|
| Sunderland | Car manufacturing; goods exports | Trade remained tariff-free, but factories had to prove component origins. The investment case became more conditional. |
| Boston | Agriculture; pre-2016 EU labour | Free movement ended. Seasonal and skilled-worker visas replaced part of the labour supply with paperwork. |
| Stoke-on-Trent | Ceramics; weak productivity | Trade friction added a new fixed cost on top of a regional economy already struggling for investment and skills. |
Three places, three different forms of exposure. Sources: ONS sub-regional labour-market data; Centre for Cities economic profiles; Becker, Fetzer and Novy district-level Brexit research, 2017–2024.
Rules of origin are the hidden tax in a tariff-free deal. A product crosses the border without tariffs only if enough of its value is local. Firms now have to trace components, change suppliers or pay intermediaries to certify what membership of the single market used to assume. The cost sits in compliance budgets long before it shows up in trade totals — which is why both the "collapse" narrative and the "tariff-free" narrative missed the actual mechanism.
The migration promise was not false in the narrow sense. The UK ended free movement on 31 December 2020 and built a new visa system that treats EU citizens the same as everyone else. Net migration from the EU collapsed: from a peak of plus 253,000 in 2016 to minus 42,000 in the year to December 2025 (ONS, Long-term international migration, May 2026). That is a real sovereign choice, and a real result. What happened next was not.
Total net migration peaked at 891,000 in 2022 and was still 848,000 in 2023 — more than three times the pre-Brexit average. The new system did not deliver lower numbers. It delivered a different mix. The reason is that the rules collided with three unrelated events.
The first was the British National (Overseas) visa, opened in January 2021 for Hong Kong residents after Beijing imposed a sweeping national security law on the territory in June 2020. The route was designed as a moral response to a foreign policy crisis; it has brought over 150,000 people. The second was Ukraine: after Russia's invasion in February 2022, the UK opened humanitarian schemes that brought several hundred thousand more. Neither of these was a labour market decision. Both ran on top of the points-based system rather than through it.
The third was where the new system itself was deliberately loosened. The 2021 rules lowered the salary and skill thresholds for the Skilled Worker visa from previous Home Office benchmarks, abolished the cap on annual numbers, and removed the requirement for employers to advertise locally before sponsoring a foreign worker. The Health and Care Worker visa, opened in August 2020, was then expanded in February 2022 to include lower-paid social-care roles after acute NHS and care-home staffing shortages — many of which had themselves been worsened by EU workers leaving during the pandemic. The Graduate route, opened in July 2021, allowed any international student finishing a UK degree to stay for two years (three for doctorates). Until early 2024, most postgraduate students could bring family with them, which is why work and study together drove most of the surge.
When the political cost of those numbers became unmanageable, the rules tightened. In 2024 and 2025, dependants on most study and care routes were restricted, salary thresholds were raised, and in May 2025 the care-worker route was closed to new overseas recruitment. Net migration fell to 171,000 by the end of 2025. The Migration Advisory Committee — the government's own expert panel — has said that without further policy changes, long-run net migration is likely to settle around 300,000 per year (Migration Advisory Committee, May 2025).
What this did to the economy is harder to see but more important. NIESR estimated in early 2023 that the UK labour market was short of roughly 330,000 workers as a direct result of Brexit, concentrated in lower-paid sectors that had relied on European workers — social care, hospitality, agriculture, food processing, warehousing, and the heavy goods drivers whose 2021 absence caused the petrol shortages people queued for. Skilled European workers had previously been able to take a UK job on the same day they decided to. Now they need an employer sponsorship licence, a visa fee, a health surcharge and a several-month wait. The friction is small at the margin and large at the aggregate.

| Year to December | Total net | EU | Non-EU | British |
|---|---|---|---|---|
| 2016 | 249,000 | 253,000 | 90,000 | −94,000 |
| 2019 | 184,000 | 80,000 | 186,000 | −82,000 |
| 2020 | 93,000 | 70,000 | 101,000 | −78,000 |
| 2022 | 891,000 | −9,000 | 981,000 | −81,000 |
| 2023 | 848,000 | −53,000 | 1,005,000 | −104,000 |
| 2024 (revised) | 331,000 | −63,000 | 511,000 | −117,000 |
| 2025 (provisional) | 171,000 | −42,000 | 350,000 | −136,000 |
ONS net migration estimates, May 2026 vintage. Estimates for late 2024 and all of 2025 are provisional. Figures rounded to the nearest thousand.
The arithmetic of an economy starts with the workforce. Fewer working-age people who pay tax, build things, drive lorries or look after the elderly means a smaller national output and a tighter labour market. That is why losing several hundred thousand European workers — and replacing them with workers from further away, on more expensive visa routes — was never a neutral swap. Some of those losses show up in shop closures, care-home vacancies, fruit unpicked in fields, and the kinds of price rises an inflation index does not catch.
The migration promise was not lower numbers. It was a change of queue.
London did not collapse. That line is too easy. The Global Financial Centres Index, the most widely cited ranking of finance hubs, still has London second in the world in March 2026, one rating point behind New York. But "passporting" — the system that let any UK-authorised bank, insurer or asset manager sell services freely across the rest of the EU on a single licence — disappeared on 1 January 2021 and was not replaced. The two sides agreed a memorandum to talk about financial regulation, but that document is a forum for dialogue, not a route back to market access (House of Commons Library, Brexit and financial services, February 2021).
The result was not exodus. It was duplication. To keep selling into the rest of the EU, banks, insurers and asset managers expanded existing offices or built new ones in Frankfurt, Paris, Dublin, Luxembourg and Amsterdam. Client books, risk teams and balance sheets had to sit on the right side of the border when European rules required it. Before the referendum, industry forecasts from the City of London's own lobbying body warned that 75,000 to 100,000 financial-sector jobs were at risk in worst-case scenarios. The actual number of announced moves landed closer to 7,000 to 10,000, depending on which tracker you read. The gap between the forecast, the announced relocations and the realised drag is the real story: a global city absorbed a shock by making itself more expensive to run.
London's listing market tells the same story in miniature. For most of 2025, the headlines about the London Stock Exchange were grim. The full-year picture is different. The consultancy EY-Parthenon counted 23 main-market flotations raising £2.1bn in 2025, up 170 per cent on the £777.7m raised by 18 companies in 2024 (EY-Parthenon, IPO Eye, January 2026). That is recovery from a thin year, not proof that Brexit helped. London's flotation problem is partly Brexit, partly a global slowdown in new listings, partly the high valuations available in New York, and partly the absence in the UK of the kind of large pension-fund growth capital that drives demand for new stock. The financial regulator's listing reforms in 2024 and 2025 are competitiveness tools, not magic.
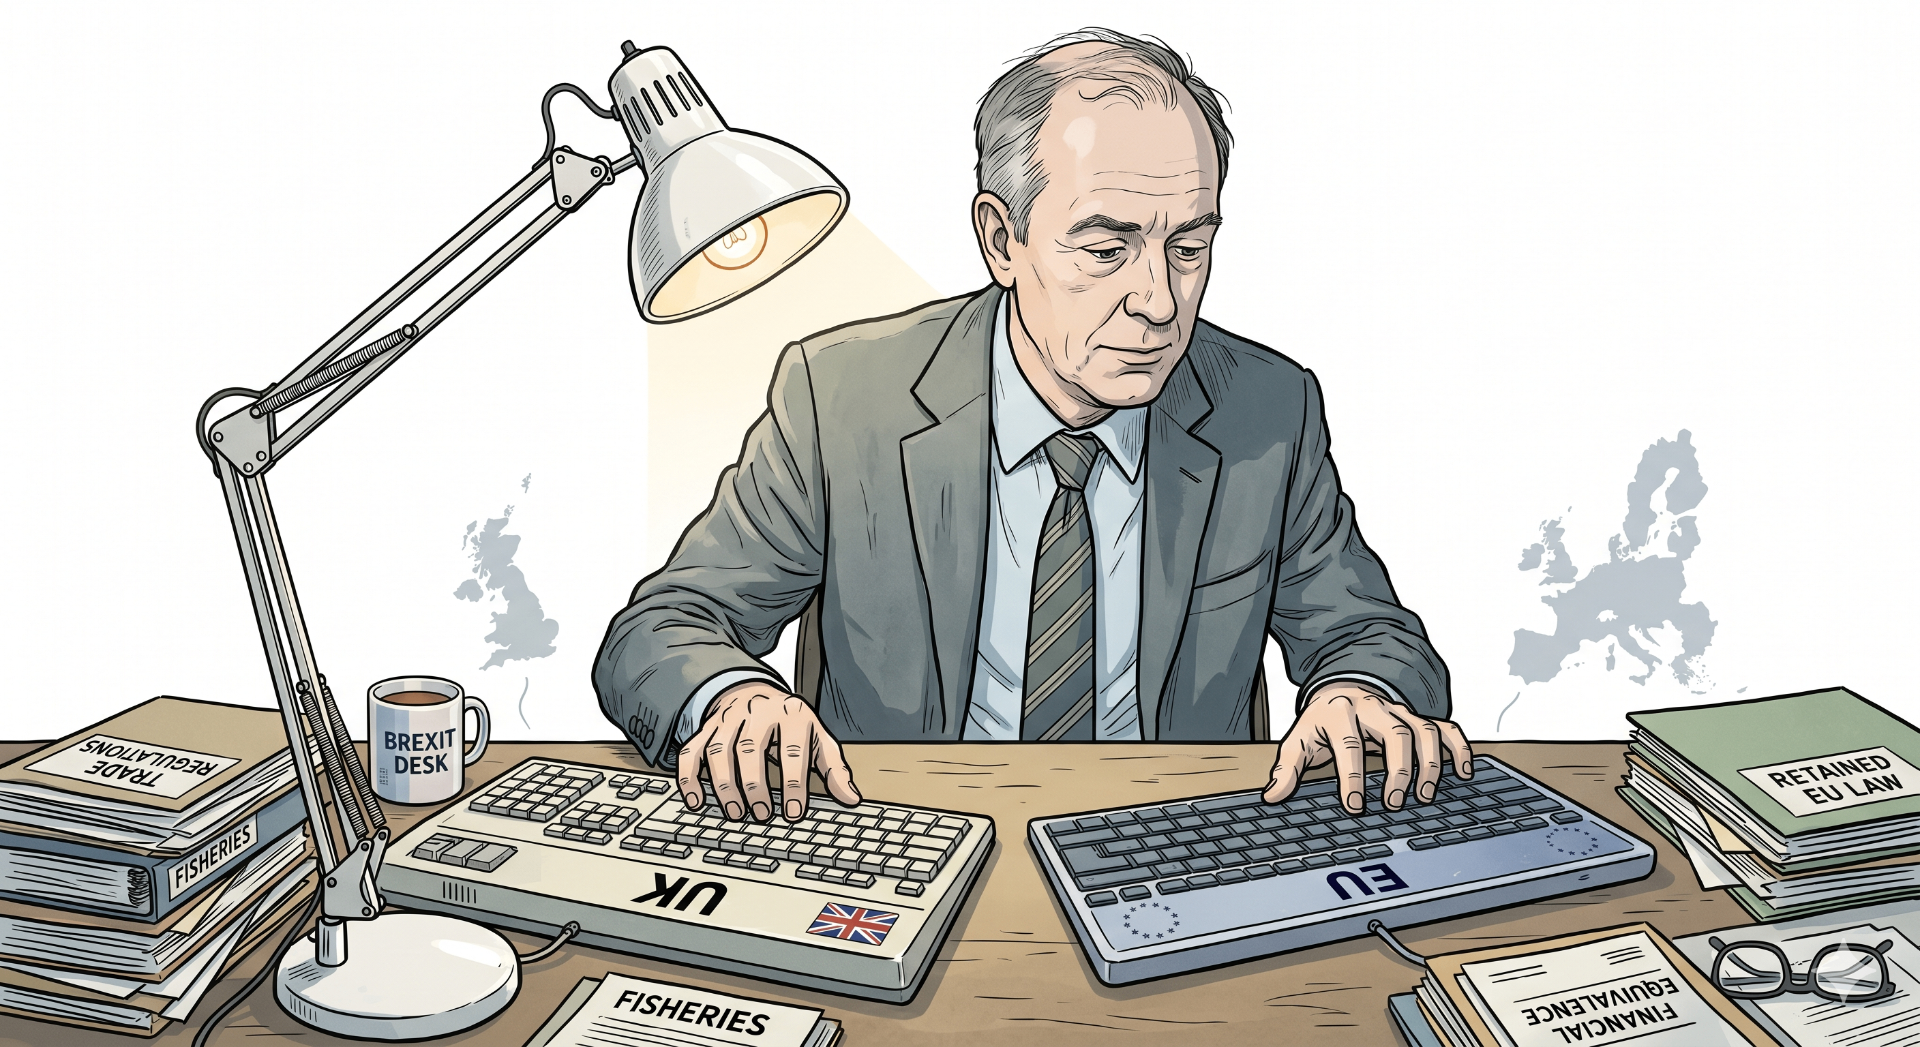
The City did not collapse. It built a second City inside the EU and charged its clients for the duplication.
— Synthesis from Commons Library financial-services briefings, HM Treasury / EU MoU material, EY Financial Services Brexit Tracker and GFCI 39, 2023–2026
| Measure | What it captures | How to read it |
|---|---|---|
| 75,000–100,000 jobs at risk | Pre-event downside forecast | A scenario, not an observed result. |
| Announced relocations and EU subsidiaries | Operational adaptation 2017–2024 | Evidence of duplication and market-access insurance, not of collapse. |
| London 2nd in GFCI 39 | Global financial-centre standing, March 2026 | Evidence against collapse, not evidence against cost. |
Sources: TheCityUK / Oliver Wyman 2016–17 pre-event forecast; EY Financial Services Brexit Tracker; Z/Yen and Long Finance GFCI 39, March 2026.
The clearest answer to "what was Brexit actually for?" is the rewrite of how British insurance companies are allowed to invest. Insurers — the firms that pay annuity pensions and life-insurance contracts — sit on enormous pools of long-term money. The previous EU rulebook required them to hold that money in a tightly defined set of safe assets, mostly government bonds. The new UK regime, called Solvency UK, was designed to let insurers put more of that money into the things the country needs to fund: infrastructure, housing, utilities and productive private companies.
The Bank of England's prudential arm, which supervises insurers, finalised the new framework in two stages. In June 2024, it widened the range of assets insurers could use to back annuity promises, with a cap on the riskier categories and a personal sign-off — called an attestation — by senior executives. Then in October 2025, the regulator added a fast-track approval system so that firms with existing permission could deploy new assets quickly, with twenty-four months to clean up the paperwork. This is sovereignty as a working tool, not a flag in a window.
The caution is in the numbers. The insurance industry's own trade body says its members put £10.9bn into UK productive assets in 2024 — £3.8bn into property, £2.7bn into utilities, £1bn into transport and £3.4bn into other sectors (Association of British Insurers, Industry pledge progress report, Summer 2025). That is real deployment. But the same report carries an honest caveat: the direct impact of the rule change cannot yet be quantified, because the reforms are bedding in and investment decisions have many drivers. The three largest UK annuity writers — Phoenix, Legal & General and Aviva — are putting some released capital into productive assets and some into other balance-sheet uses. The mix matters more than the headline pledge.
The May 2025 Mansion House Accord was a parallel push on workplace pensions: seventeen pension providers, covering roughly 90 per cent of active UK savers in defined-contribution schemes, pledged to put 10 per cent of their portfolios into private and productive assets by 2030, with at least half of that ringfenced for the UK. The Treasury estimates that could unlock up to £50bn, of which £25bn would land directly in the UK economy. The policy is serious. The payoff depends on the pipeline of investable projects, on planning permissions, on infrastructure delivery and on regulators who can move at the speed of capital without pretending risk has gone away.
| Reform | What changed | Why it matters |
|---|---|---|
| New asset rules | Insurers can back annuities with a wider range of assets, including infrastructure and private credit, with safeguards | More long-term money pointed at productive UK investment. |
| Fast-track approval | Firms with permission can deploy new assets immediately, with 24 months to regularise | Turns regulatory permission into deployment speed. |
| 2024 deployment | £10.9bn invested in UK productive assets across property, utilities and transport | Real investment — but the share specifically driven by the reforms cannot yet be measured. |
| Pension accord | 17 providers covering ~90% of UK DC savers pledged 10% in private assets by 2030 | Adds pension capital to the same productive-investment push. |
The Solvency UK reforms in plain English. Sources: Bank of England consultation paper, September 2023; final policy, June 2024; fast-track policy, October 2025; ABI progress report, Summer 2025; HM Treasury Mansion House Accord, May 2025.
Sovereignty is not a dividend. It is an option with an annual management fee.
The hard part is not freeing up capital on a spreadsheet. It is matching the long, predictable payouts insurers owe their customers — pensioners drawing annuities, for thirty years and counting — to assets whose cash flows are equally long and equally predictable. A water-company bond, a private infrastructure loan and a mortgage portfolio behave differently when something goes wrong. The regulator's attestation requirement is where the political promise meets the actuarial reality. If anything goes wrong with these reforms in the next decade, it will be tested there.
Most of the Brexit conversation in Great Britain barely mentions Northern Ireland. It should. Northern Ireland is the place where the trade-off between sovereignty and access is most concretely visible — and the model for how the rest of the UK is now negotiating its way back into selective access to the EU.
Under the Windsor Framework — the 2023 deal that replaced the older Northern Ireland Protocol — the territory sits inside the UK's customs system but applies the EU's rulebook for goods. Goods coming from Great Britain into Northern Ireland for local consumption move through a "green lane" with minimal checks. Goods that might end up in the Republic of Ireland — and therefore inside the EU's single market — move through a "red lane" with full single-market controls. The Northern Ireland Assembly has a procedural veto, the "Stormont Brake", over any new or amended EU rule that would apply locally.
The economics do not match the predictions of either side. The Northern Ireland Department for the Economy reported in 2026 that 63.6 per cent of business sales and 58.8 per cent of purchases in 2024 were inside Northern Ireland itself. Trade with both Great Britain and the Republic of Ireland grew. The consultancy PwC projected Northern Ireland as the fastest-growing UK region in 2024 at 1.2 per cent real growth. The Republic remains a richer comparator overall — Irish income per head was 57 per cent higher than Northern Irish output per head in 2022 (Economic and Social Research Institute, 2025) — but that gap predates Brexit and reflects very different growth models.
The political cost is harder to wave away. Northern Irish firms that trade in goods now navigate two regulatory regimes at once. The Assembly was suspended for years partly in protest at the Protocol's arrangements. The Stormont Brake has been invoked, with an independent review under way. The Windsor Framework is not the final answer; it is a holding pattern that lets the rest of the UK ignore an unresolved question. As the wider UK-EU reset opens negotiations on food safety, energy and carbon pricing, Northern Ireland is the model the rest of the country is being asked to follow.
Northern Ireland is where the UK already knows what it costs to follow EU rules without writing them. The rest of Britain is now negotiating its way into the same conversation.
— Synthesis from House of Commons Library briefings on the Windsor Framework, the Institute for Government's explainer, and the May 2025 UK-EU summit communiqué
Northern Ireland is not the exception to the Brexit settlement. It is the rest of the UK five years from now.
The most revealing sovereignty choices are the ones Britain did not make. On banking rules, the UK had freedom to set its own capital standards but ended up broadly aligned with the EU's new framework, because banks compete globally and being an outlier hurts. The implementation timetable then slipped to 2027 anyway. On product safety, Britain was supposed to replace the EU's "CE" safety mark with its own domestic version. After years of business pushback and quiet extensions, the government accepted in August 2023 that it would recognise the EU mark indefinitely; the British alternative effectively shelved.
On data protection, the UK has the legal power to diverge from EU rules, but the EU's "adequacy" decision — its judgement that British data law is good enough to allow data to flow freely from Europe to Britain — is worth more than divergence. The Data (Use and Access) Act 2025 was deliberately written narrowly to preserve that. On working hours, ministers under previous governments floated rewriting EU-derived employment law more sharply. Employers preferred stability. On state subsidies, the UK replaced the EU's state-aid rules with its own framework, but the trade deal itself still contains rules limiting what either side can subsidise.
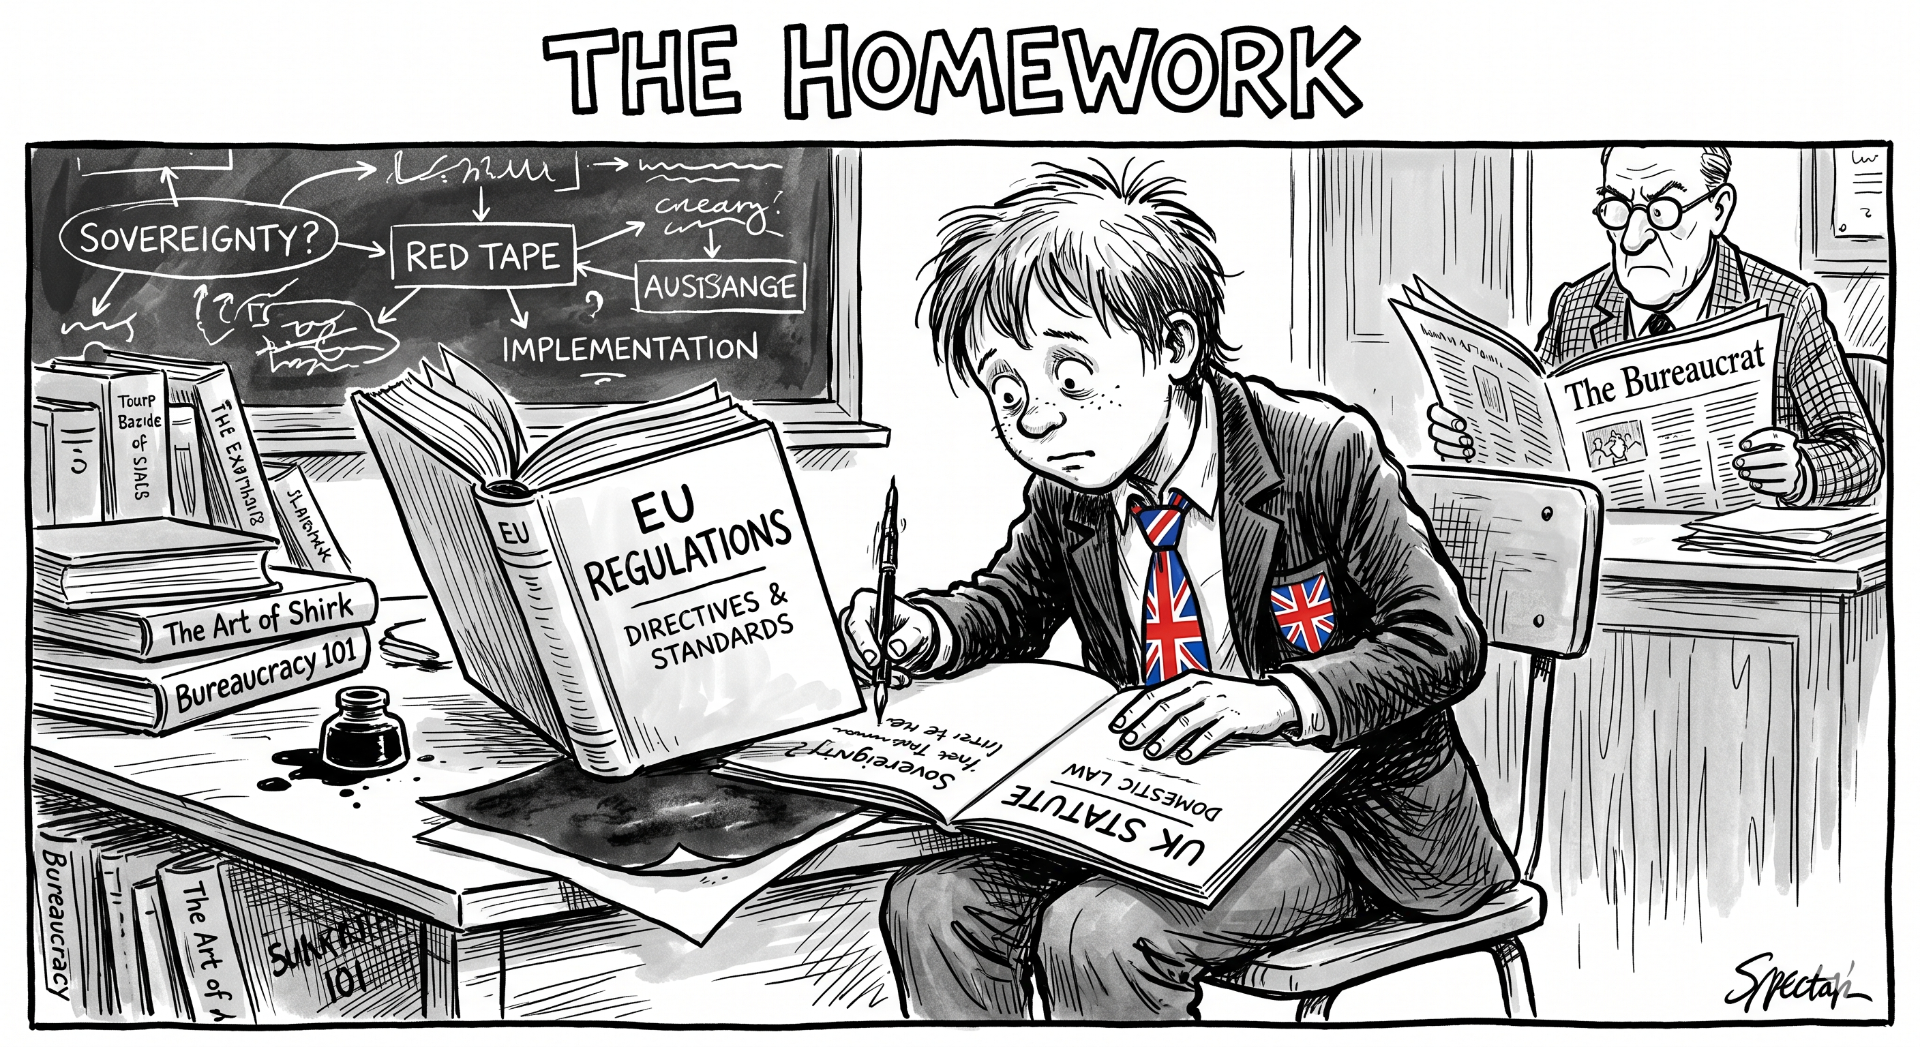
This is not failure. It is the discovery that sovereignty is not the same as maximum difference. It is the capacity to choose difference where the benefit clearly beats the cost. Britain can — and does — diverge in insurance, in listings, in farm subsidies, in gene-editing rules, in public procurement and in parts of data law. Each act of divergence consumes regulatory bandwidth and creates a second compliance question for firms that also trade with Europe. Choosing not to diverge is not evidence that Brexit was an illusion. It is evidence that autonomy has a price tag, and that a serious government uses the pen sparingly.
| Area | Freedom after Brexit | Why restraint won |
|---|---|---|
| Bank capital rules | Own implementation timetable and detail | Global comparability matters; outliers face investor penalties. |
| Product safety marks | Domestic safety mark to replace EU's CE | Business cost forced indefinite recognition of the EU mark. |
| Data protection | Domestic rewrite of data law | Keeping EU 'adequacy' is more valuable than the divergence. |
| Working hours and leave | Rewrite of inherited employment law | Employers preferred stable compliance to legal upheaval. |
| State subsidies | Replacement of EU state-aid regime | Trade deal still limits what either side can subsidise. |
Five places where Britain was free to diverge and chose restraint. Sources: Bank of England and Financial Conduct Authority materials on capital rules; UK Government CE/UKCA marking guidance; UK GDPR and Data (Use and Access) Act 2025; retained EU law and the Subsidy Control Act 2022.
Britain took back the pen and spent five years deciding when not to use it.
The negotiations now under way between London and Brussels are the Brexit settlement in slow motion. At a summit in May 2025, the two sides published a "Common Understanding" — not a treaty, but a sketch of where things might go — covering food and animal checks, energy trading, the linking of the UK's and the EU's carbon-pricing systems, security cooperation and a possible youth-mobility scheme. The Commons Library is careful to note that most of the economic content still needs detailed legal text, parliamentary approval and political compromise on both sides. The formal review of the 2020 trade deal in 2026 is, on paper, a review of how the existing deal is working, not an automatic renegotiation.
Each item in the package is a small version of the original Brexit trade-off. The clearest example is food. British supermarkets, farmers and food exporters would like to see fewer checks at the border, because veterinary and food-safety paperwork is visible, expensive and slow. The EU is willing to lower those checks — but only if the UK agrees to align with European food and animal-welfare rules as they evolve, and to accept some sort of dispute mechanism if it doesn't. That is the original Brexit choice in miniature: lower friction in return for accepting rules written elsewhere.
Energy and carbon pricing carry the same logic. Britain can rejoin parts of the European electricity market and link its carbon-pricing system to the EU's, with real efficiency gains for both sides — at the cost of taking the EU's design decisions as given. Youth mobility is where the negotiation turned political. The European Commission wanted a broad scheme with no overall cap and no time limit. The UK government countered with a cap of around 100,000 a year and a maximum stay of two years. The Treasury then refused to remove the immigration surcharge that visitors would have to pay to use the NHS. Talks stalled less on legal technicalities than on the price of letting young Europeans live and work in the UK again.
Public opinion is more complicated than the headlines suggest. Polling by YouGov, NatCen and Ipsos all shows higher regret about Brexit and more support for rejoining the EU than at any point since the referendum. But that support narrows substantially when the question is "rejoin with free movement", "rejoin with budget contributions", or "rejoin and adopt the euro". The gap between those numbers is the politics of the next decade: voters dislike the bill that arrived but are not necessarily willing to pay the price of cancelling the purchase.
| Claim | What the data actually shows |
|---|---|
| Brexit caused the 2022 cost-of-living crisis (Remain claim) | The Bank of England and LSE economists attribute most of it to global energy and food shocks. Brexit shows up specifically as roughly 8–10% of food-price inflation. |
| Brexit cost £100 billion a year (Remain claim) | Credible single-year estimates sit between £40bn and £80bn, depending on the horizon. The £100bn number relies on assumptions most economists would not defend. |
| The UK's productivity gap is a Brexit problem (Remain claim) | The productivity slowdown started long before 2016. Brexit may have widened it; it did not start it. |
| Brexit freed £350 million a week for the NHS (Leave claim) | Net contributions after rebates were lower. Most of the saving was absorbed by farm subsidies, customs infrastructure and the Northern Ireland arrangements. |
| New trade deals replace lost EU trade (Leave claim) | The Department for Business and Trade's own modelling puts the Australia deal at +0.08% of GDP by 2035 and the India deal at +0.13% by 2040. EU trade is far larger. |
| The points-based system cut total migration (Leave claim) | Net migration was higher post-Brexit than at the referendum until policy tightening in 2024–2025. The system changed the mix, not the headline. |
Six common Brexit claims, three from each side, that the underlying data does not support. Sources: ONS UK trade data; Bank of England and LSE Centre for Economic Performance inflation analyses; Department for Business and Trade impact assessments; ONS migration statistics; Migration Advisory Committee report, May 2025.
A food-checks deal lowers friction at the border only by reopening the question Brexit was meant to close: whose rules decide what crosses it.
— House of Commons Library briefings on the 2025 UK-EU summit and the 2026 trade-deal review
When the European Commission puts food, energy, carbon and youth mobility into a single package, it is not being unreasonable — it is using leverage. If each item were negotiated separately, the UK could bank the easy wins and reject the politically painful ones. Bundling forces a trade: access in one area is paid for with rules or mobility in another. The UK is trying to unbundle. The EU is trying not to let it.
The most truthful thing to say about Brexit ten years on is that both sides got something they recognised, and both sides got something they did not expect.
Brexiteers were right that sovereignty was real — the UK now writes its own immigration rules, designs its own insurance regime, runs its own subsidy system, and chooses whether to track EU regulations or not. They were also right that the catastrophe forecasts of 2016 did not materialise. The UK did not enter immediate recession. London did not collapse as a financial centre. Goods trade with the EU did not disappear. The economy carried on functioning.
Remainers were right that the bill was real, and larger than the campaign acknowledged. The country produces less than it would have done. The trade hit to goods is structural rather than temporary. Smaller and less-resourced firms have absorbed more of the cost than their larger competitors. The migration promise of lower numbers was delivered only when the government reversed parts of its own visa policy in 2024 and 2025. The City survived by building a parallel office in Frankfurt and Paris.
Both sides also got what they did not bargain for. The "control" the Brexit campaign promised turned out to require ongoing political effort and Whitehall capacity to operate. The "softer Brexit" of an embedded trading relationship that some Remainers hoped for turned out to require accepting the same external rules that Brexit was supposed to escape. The 2025–2026 reset is the most honest part of the settlement: both sides negotiating, item by item, the price of friction reduction.
The country did take back control. What it bought with that control turned out to be a series of operating decisions — and the line that was missing from the side of the bus was the operating budget.
Britain took back control. The line missing from the bus was the operating budget.
You’ve looked beneath the surface.
A connection through “Who really owns it?”: Follow the ownership and control behind infrastructure, money, and information.
A connection through “Who really owns it?”: Follow the ownership and control behind infrastructure, money, and information.
A connection through “Who really owns it?”: Follow the ownership and control behind infrastructure, money, and information.